ab-testing
# Overview
A/B testing is a popular way to test your products. A/B testing is one of the most prominent and widely used statistical tools.
# Example Scenario
You have made certain changes to your website recently. Unfortunately, you have no way of knowing with full accuracy how the next 100,000 people who visit your website will behave. That is the information we cannot know today, and if we were to wait until those 100,000 people visited our site, it would be too late to optimize their experience.
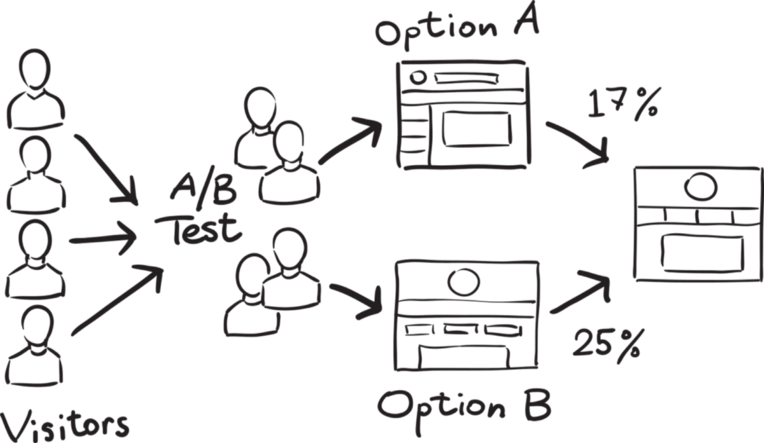
Here A will remain unchanged while you make significant changes in B’s packaging. Now, on the basis of the response from customer groups who used A and B respectively, you try to decide which is performing better.
# What is A/B testing?
A/B testing is a basic randomized control experiment. It is a way to compare the two version of a variable to find out which performs better in a controlled environment.
It’s a hypothetical testing methodology for makin decisions that estimate population parameters based on sample statistics.
- Population: All customers buying the product
- Sample: The number of customers that participated the test
# Steps
# 1. Make a Hypothesis
A hypothesis is a tentative insight into the natural world
A hypothesis-testing is a concept that is not yet verified, but if true would explain certain facts or phenomena.
In this example, the hypothesis can be “By making changes in the design of the new page in the website, we can get more traffic on the website”
Null hypothesis $H_0:$
- $H_0:$ There is no difference in the conversion rate in customer receiving pages A and B
Alternative hypothesis $H_1:$
- $H_1:$ The conversion rate of pages B is higher than those who receive newsletter A
# 2. Create Control Group and Test Group
Dedcide the group of customers that wil participate in the test.
The control group is the one that will receive newsletter A and the test group is the one will receive newsletter B.
For an experiment, we randomly select 1000 cutomers using random-sampling. 500 each for control group and testt group.
We must take care of the sample size. It’s required that we determine the minimum sample size for our A/B testing before confucting it so that we can eliminate under-coverage-bias. It’s the bias from smapling too few observations.
# 3. Conduct A/B Test and Collect the Data
One way to perform the test is to calculate daily conversion-rate for both the treatment and the control groups. Since the conversion-rate in a group on a certain day represents a single datat point, the sample size is actually the number of days. Thus, we will be testing the difference between the mean of daily conversion rates in each group across the testing period.
When we run our experiment for one month, we noticed that the mean conversion-rate for the control group is 16% whereas that for the test group is 19%.
Can we conclude from here that the Test group is working better than the control group? -> Use statistical test
# Statistical Significance of the Test
For rejecting out null hypothesis we have to prove the statistical significance of our test.
An experiment is considered to be statistically significant when we have enough evidence to prove that the result we see in the sample also exist in population.
To prove the statistical significance of the experiment, we can use two sample t-test.
# Code
# Check whether 2 groups are similar or not
Steps:
- Split and define control & test group
- Check normality: Shapiro test (pval > 0.05 = normal)
- If group A & B normal -> check homogeneity of variance using levene test (pval > 0.05 = homogen) -> ttest (H0: M1 == M2)
- If one of A / B not normal -> non-parametric mann whitney u test
Code sample
| |