confusion-matrix
# Summary
A good model has high TP and TN, while low FP(error 1 $\alpha$) and FN(error 2 $\theta$). Or F1 score has high value
Accuracy:
- How often the classifier makes correct predictions
- It’s the ratio (num of correct pred / total num of pred)
- It’s a useful metric when the true positives and true negatives are more important
- Not suited for imbalanced data (when model predicts each point belongs to majority class label, the accuracy will be high but the model is not accurate)
- A valid choice of evaluation for classification problem if the data are well balanced and not skewed.
Precision:
- How many predictions are actually positive out of all the total positive predicted
- It’s the ratio (num of correctly classified positive / total num of predicted positive) TP/(TP+FP)
- Ideally precision should be high
- It’s a useful metric in cases where false positive is a higher concern than false negative
- Case 1: In spam detection we try to reduce FP (positive mail is not spam but predicted as spam)
- Case 2: In recommendation systems, wrong result could lead to customer churn (good matched content predicted as bad content)
Recall / sensitivity:
- How many observations of positive class are actually predicted positive
- It’s the ratio (num of correctly classified positive / total num of actual positive) TP/(TP+FN) or (1 - error type 2)
- A valid choice when we want to capture as many positives as possible
- It’s a useful metric in cases where false negative trumps false positive
- It would be a better metric because we don’t want to accidentally discharge an infected person.
- Case 1: Medical cases where it doesn’t matter whether we raise false alarm(FP), but the actual positive cases should not go undetected!(FN)
- Case 2: A person suffering from cancer but the model predicted not suffering (FP)
Specificity:
- It’s the ratio (true negative / all negative outcomes) TN/(TN+FP)
- It’s useful if you concerned about the accuracy of your negative classes, and there is a high cost to a positive outcome
- Case: Auditor looking over financial transactions, and a positive outcome would mean a one year investigation, but not finding one would only cost the company $50
F1 Score:
- It’s a number between 0 and 1
- It’s the harmonic mean of precision and recall. It’s maintains a balance
- Harmonic mean is not sensitive to extremely large values (unlike simple average does). Harmonic mean punishes extreme values more
- If your precision is low, the F1 is low. If the recall is low again, your F1 score is low
- It’s a better metric for imbalance data
- It’s useful when there is no clear distinction between whether precision is more important or recall is more important. We combine them!
- When we try to increase precision, the recall goes down and vice-versa. F1 score capture both trends in a single value
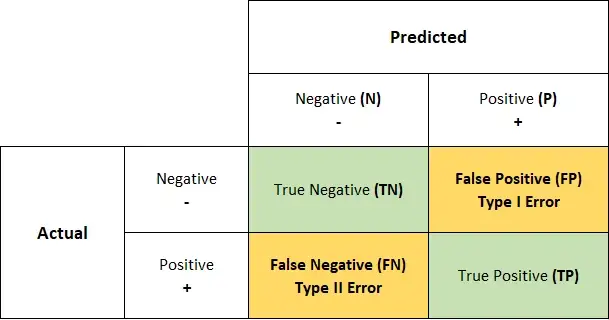
# What is confusion matrix?
Confusion matrix is a table layout that allows visualization of the performance of an algorithm. It is an $N \times N$ matrix used for evaluating the performance of a classification model, where $N$ is the number of target classes. The matrix compare the actual target values with those predicted by the model. It’s a tabular summary of the number of correct and incorrect predictions made by a classifier.
Each row represents the instances in an actual class, while each column represents the instances in a predicted class. It is a special kind of contingency-table.
In unsupervised learning, it usually called a matching-matrix
Key takeaway:
- A good model is one which has high TP and TN rates, while low FP and FN rates
- If you have an imbalance dataset, it’s better to use confusion matrix as your evaluation criteria
# Terminology
P (Condiiton Positive)
- The number of real positive cases in the data
N (Condition Negative)
- The number of real negative cases in the data
TP (True Positive)
- You predicted positive and it’s true
- When the actual value is positive and predicted is also positive
- A test result that correctly indicates the presence of a condition or characteristic
TN (True Negative)
- You predicted negative and it’s true
- When the actual value is negative and predicted is also negative
- A test result that correctly indicates the absence of a condition or characteristic
FP (False Positive) / Type 1 error
- You predicted positive and it’s false
- When the actual is negative but prediction is positive
- A test result which wrongly indicates that a particular condition or atribute is present
FN (False Negative) / Type 2 error
- You predicted negative and it’s false
- When the actual is positive, but the prediction is negative
- A test result which wrongly indicates that a particular condition or attribute is absent
# Why we’re not using only accuracy?
In classification accuracy, there is no information about the number of misclassified instances. It’s not suited for imbalanced classes
# Classification Measure
Accuracy
- How often the classifier makes the correct prediction
- It’s the ratio between the number of correct predictions and the total number of predictions- Not suited for imbalanced classes